
Telemetry
Telemetry is the automated collection and transmission of data from your application during runtime. It plays a critical role in observability, the ability to understand and diagnose the internal state of a system based on the data it produces.
Instrumenting your application with telemetry means that you’re enabling it to emit signals such as logs, metrics, and traces that describe its behavior and performance.
High-quality telemetry helps you detect issues, monitor performance, and understand how your system behaves in production.
This library uses OpenTelemetry for tracing. OpenTelemetry is a CNCF (Cloud Native Computing Foundation) open source project that provides comprehensive support for distributed tracing.
Requirements
Telemetry is a completely optional feature of this library.
When installing via pip install voraus-robot-arm telemetry is disabled.
If telemetry is desired, install voraus-robot-arm with the desired optional feature like so:
pip install voraus-robot-arm[telemetry]
By doing so, the OpenTelemetry API will be used by the library.
In order to provide a working implementation of the OpenTelemetry API, the Opentelemetry SDK must be used by the application.
To install the OpenTelemetry SDK execute:
pip install opentelemetry-sdk
Tracing
Traces represent the full path of a request through an application. They are very helpful to understand what exactly happens when a given request is made. Traces consist of one or more units of work (spans).
Exporting telemetry to a database or UI requires an OpenTelemetry exporter. OpenTelemetry provides exporters for different telemetry backends like Jaeger, Zipkin, Prometheus, OTLP and OpenCensus.
In the following Jaeger is used as tracing backend.
Jaeger natively supports the OpenTelemetry protocol (OTLP), hence the OTLP exporter has to be installed:
pip install opentelemetry-exporter-otlp-proto-http
The Jaeger service can be started via:
docker run --rm --name jaeger \
  -p 16686:16686 \
  -p 4317:4317 \
  -p 4318:4318 \
  -p 5778:5778 \
  -p 9411:9411 \
  jaegertracing/jaeger:latest
Verify that the service is reachable by opening http://localhost:16686 in a browser.
Within the application, the OpenTelemetry tracer must be created and configured. An example of that is given below:
def setup_otl_tracing() -> None:
    """Set up OpenTelemetry tracing export."""
    otl_resource = Resource.create(
        attributes={SERVICE_NAME: "example-robot-application"}
    )
    tracer_provider = TracerProvider(resource=otl_resource)
    processor = BatchSpanProcessor(OTLPSpanExporter())
    tracer_provider.add_span_processor(processor)
    trace.set_tracer_provider(tracer_provider)
In case you want to create your own spans within your application, a tracer instance can be acquired like this:
tracer = trace.get_tracer(__name__)
For more details on instrumenting your application see the OpenTelemetry documentation.
An example is provided below:
OpenTelemetry Tracing
"""Example for using voraus-robot-arm with OpenTelemetry tracing."""

import time
from math import radians

from opentelemetry import trace
from opentelemetry.exporter.otlp.proto.http.trace_exporter import (
    OTLPSpanExporter,
)
from opentelemetry.sdk.resources import SERVICE_NAME, Resource
from opentelemetry.sdk.trace import TracerProvider
from opentelemetry.sdk.trace.export import (
    BatchSpanProcessor,
)

from voraus_robot_arm import (
    JointPose,
    Percent,
    VorausIndustrialRobotArm,
    configure_logging,
    z,
)

VORAUS_CORE_HOST = "localhost"
VORAUS_CORE_PORT = 48401

HOME = JointPose().from_list(
    [radians(d) for d in [0, -90, 90, -90, -90, 0]]
)

VERTICAL = JointPose().from_list(
    [radians(d) for d in [0, -90, 0, -90, -90, 0]]
)


def setup_otl_tracing() -> None:
    """Set up OpenTelemetry tracing export."""
    otl_resource = Resource.create(
        attributes={SERVICE_NAME: "example-robot-application"}
    )
    tracer_provider = TracerProvider(resource=otl_resource)
    processor = BatchSpanProcessor(OTLPSpanExporter())
    tracer_provider.add_span_processor(processor)
    trace.set_tracer_provider(tracer_provider)


if __name__ == "__main__":
    configure_logging()

    setup_otl_tracing()
    tracer = trace.get_tracer(__name__)

    with tracer.start_as_current_span("root-span") as span:
        robot = VorausIndustrialRobotArm()
        with robot.connect(host=VORAUS_CORE_HOST, port=VORAUS_CORE_PORT):
            robot.enable()
            robot.move_ptp(HOME)
            robot.move_linear_relative(z(0.1), velocity_mps=0.2).result()
            span.add_event("Important Event")
            robot.move_ptp(VERTICAL)
            robot.set_time_override(Percent(75))
            with tracer.start_as_current_span("waiting"):
                time.sleep(0.2)
            robot.pause_motion()
            robot.move_ptp(VERTICAL)
            robot.continue_motion()
            robot.move_ptp(HOME).result()
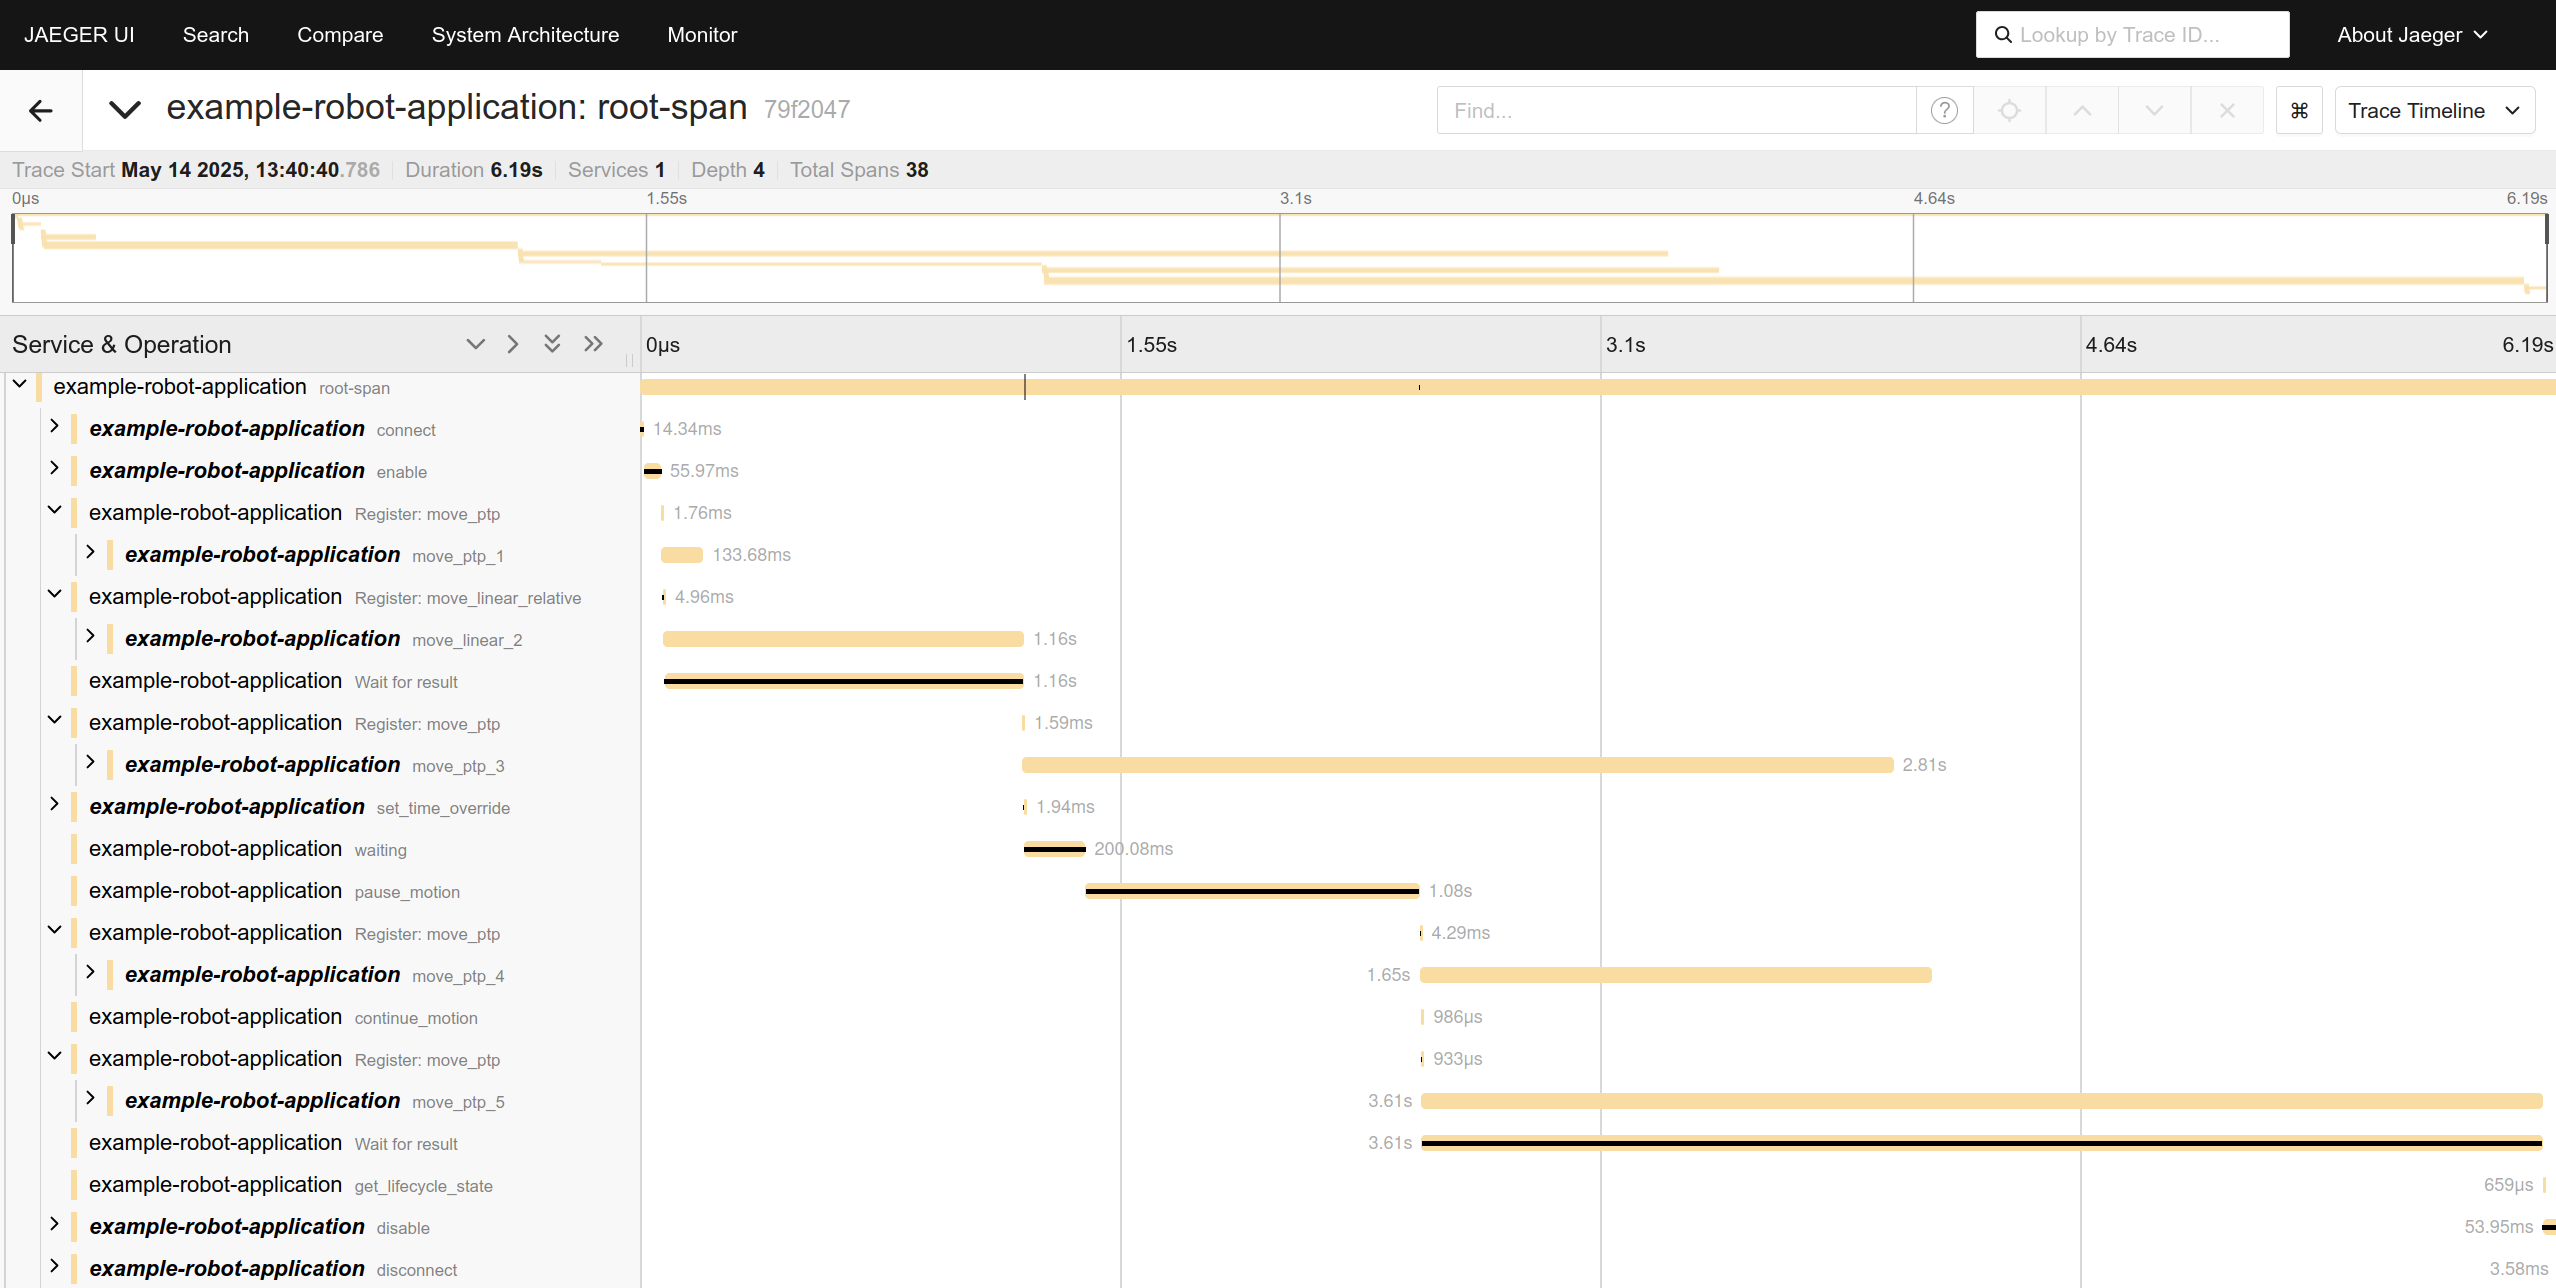
The result of this example looks like this:
Metrics
A metric is an arbitrary measurement of your application captured at runtime. Metrics are important indicators of availability and performance. The collected data can for example be used to trigger an alert and initiate the appropriate reaction.
This library does not yet emit metrics.
If you have a specific use case where it would be beneficial when voraus-robot-arm provides metrics, please contact us.
Logging
A log is a timestamped text record, either structured (recommended) or unstructured, with optional metadata. Most programming languages have built-in logging capabilities or well-known, widely used logging libraries.
This library does not yet emit it’s logs via OpenTelemetry.
Only the standard Python logging (e.g. logging to stdout or to a file) is supported.
If you have a specific use case where it would be beneficial when voraus-robot-arm also provide it’s logs
via OpenTelemetry, please contact us.