Jogging
Jogging moves one axis at a time: a single joint, or a single Cartesian axis of the tool center point.
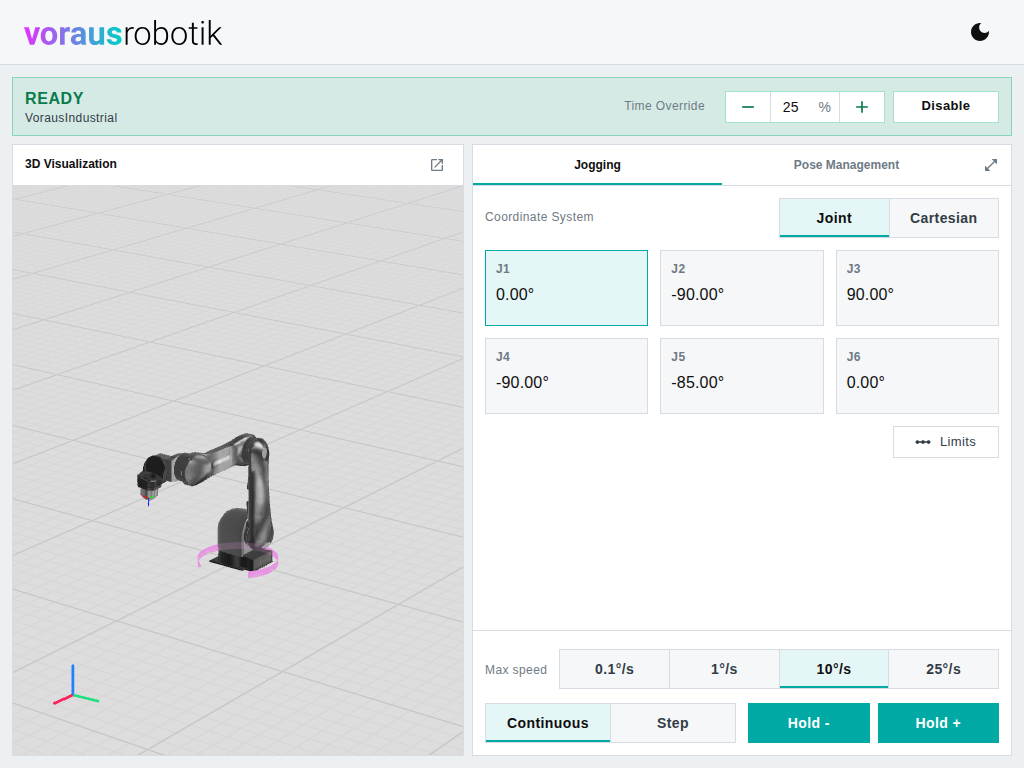
Joint lists the joints of the robot, Cartesian the six axes of the tool center point in the robot base frame. Click a tile to select the axis. The 3D visualization draws a magenta arrow along it, so you see where Hold + will move the robot. The selection is remembered per coordinate system.
In Continuous mode, Hold - and Hold + move the axis in the negative or positive direction while pressed. In Step mode, Step - and Step + move the axis by one step per press. Keep the button pressed until the step is complete. If you release it early, the robot stops where it is.
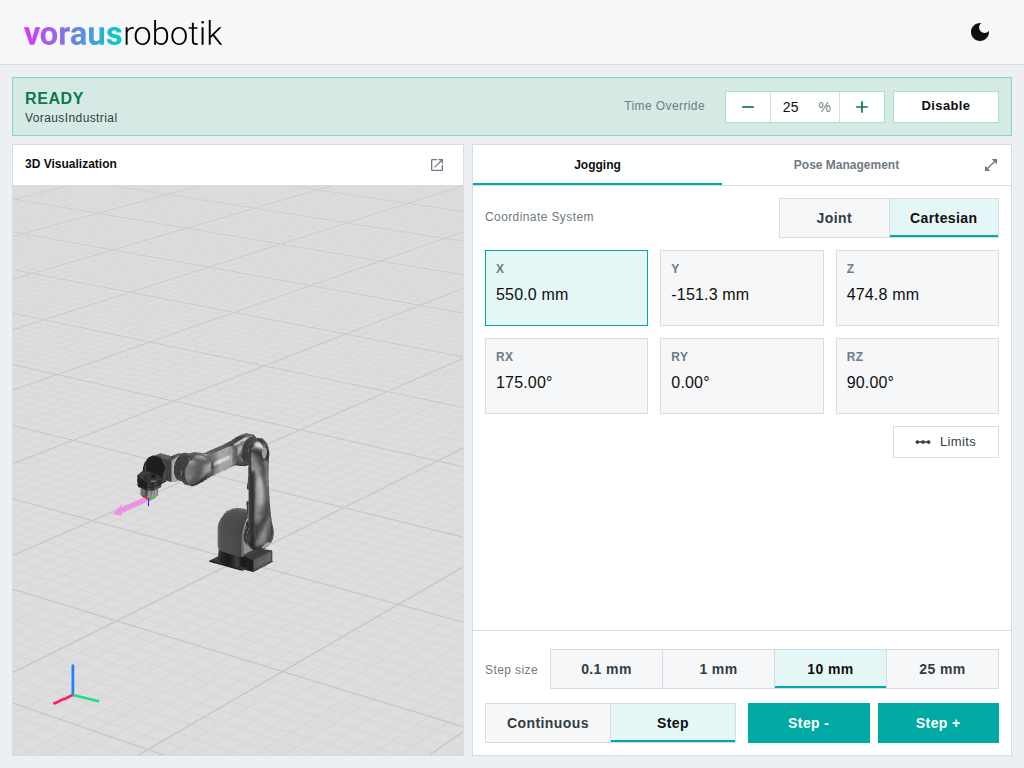
The row above the buttons selects the speed or the step size. Its presets depend on the mode and on whether the selected axis rotates or translates:
| Mode | Rotating axis | Translating axis |
|---|---|---|
| Continuous, Max speed | 0.1, 1, 10, 25 °/s | 0.1, 1, 50, 100 mm/s |
| Step, Step size | 0.1, 0.5, 1, 5 ° | 0.1, 1, 10, 25 mm |
The choice is remembered separately for rotating and translating axes. The Time Override applies on top.
Robot limits
Limits below the tiles shows the active limits of Robot Control in every tile. The button stays on until you switch it off again, and the choice is kept per browser.
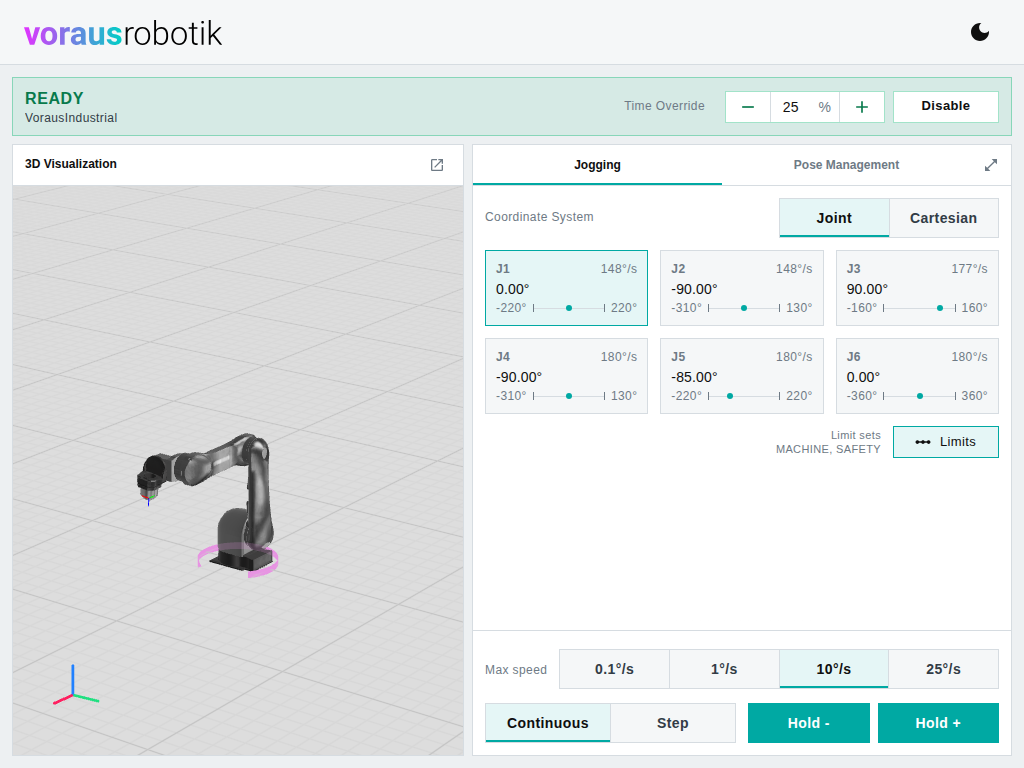
- Speed limit in the top right corner of a tile is the speed limit of the axis. Narrow tiles show only the number.
- The scale under the value runs from the minimum to the maximum position, the dot marks the current value. Within 5 % of a limit, the dot and that end turn orange, beyond it red.
- Joints show their position range and speed limit. X, Y and Z show the workspace cuboid and the translational TCP speed limit, RX, RY and RZ only the rotational one. Limits that are not configured are left out.
Limit sets next to the button names the limit sets Robot Control is currently monitoring.